I’ve been using Jungle Scout for three years. This article covers every lesson I’ve learned, every mistake I’ve made, and everything you need to know before buying. Is the data accurate? Is it worth the money? How do you actually get ROI from it? You’ll have answers by the end.
Let’s Start with Your Biggest Question: How Accurate Is the Data?
Every seller considering a paid tool has the same question in mind: How accurate are Jungle Scout’s sales estimates, really?
I’ll give you the conclusion first, then explain why.
My Own Test Results
Last year, I ran a deliberate test: I compared Jungle Scout’s estimated sales against actual sales for 30 products in my own store. Here’s what I found:
| Product Type | Sample Size | Avg. Deviation | Max Deviation | Notes |
|---|---|---|---|---|
| Commodity products (kitchen/home) | 18 | 19% | 31% | Reasonably accurate |
| Seasonal products | 7 | 34% | 58% | Large gaps in off-season |
| Apparel & accessories | 5 | 41% | 67% | Too many variations, least accurate |
My takeaway: Estimates for commodity products are reliable enough for comparison and order-of-magnitude judgment. But for apparel and heavily seasonal categories, treat the data as a rough ballpark at best.
Why the Discrepancies?
Jungle Scout uses its AccuSales™ algorithm, which essentially tracks BSR (Best Sellers Rank) fluctuations to reverse-engineer sales volume. The inherent issues with this approach:
- BSR and sales aren’t linearly correlated: Moving from rank 1,000 to rank 500 means very different sales volumes across different categories
- Variation products are hard to estimate: A parent ASIN with 20 child variations makes it nearly impossible to accurately model the sales split
- Promotions and Lightning Deals create noise: Short-term sales spikes throw off the model
Can You Trust the Search Volume Data?
The search volume data from Keyword Scout is not official Amazon data. I’ve cross-referenced it with Brand Analytics (ABA):
- Directional trends: Generally consistent — keywords JS flags as trending up also climb in ABA rankings
- Absolute numbers: Significant gaps — a keyword JS shows as 50,000 might actually be 30,000 or 80,000
How I use it: I rely on JS search volume for initial filtering and prioritization, but I always cross-validate with ABA before making final decisions. If both sources agree on the trend, I trust it. If they conflict, I go with ABA.
The Bottom Line
Think of Jungle Scout data as market intelligence, not a financial statement — it helps you see the landscape, but don’t place purchase orders based on estimated numbers alone.
What Is Jungle Scout?
If you’ve never heard of this tool, here’s a 30-second overview.
In one sentence: Jungle Scout is one of the most established Amazon seller tools on the market, around since 2015, originally built around product research.
Two Product Lines
Jungle Scout now operates as two separate products:
| Product Line | Target User | My Take |
|---|---|---|
| Catalyst | Small to mid-sized sellers | This is what we use — product research, keywords, listing optimization |
| Cobalt | Large brands / enterprises | Built for brands doing $1M+ annually. Most sellers don’t need it and can’t justify the cost |
If you’re a solo seller or a small team, Catalyst is all you need. That’s what this article focuses on.
How It Compares at a Glance
Three quick distinctions:
- vs. Helium 10: JS is simpler and more intuitive; H10 is more feature-rich but has a steeper learning curve
- vs. SellerSprite: JS is more international; SellerSprite offers better native Chinese support and lower pricing
- vs. Keepa: JS is an all-in-one tool; Keepa focuses solely on historical data but does it exceptionally well
Who is Jungle Scout best for? Sellers who want a plug-and-play product research tool without spending weeks learning the software. It just works.
Core Tools Breakdown: The Features I Actually Use
Jungle Scout has over a dozen tools, but honestly, I only use a handful on a regular basis. This section covers only the ones that actually matter — no feature-list padding.
Browser Extension — Where Product Research Starts
This is the feature I use most. Install the Chrome extension, and with one click on any Amazon page, you can see estimated sales, pricing, review counts, and more for every product on the page.
How I use it:
- Spot an interesting product? Pull up the extension for a quick data snapshot
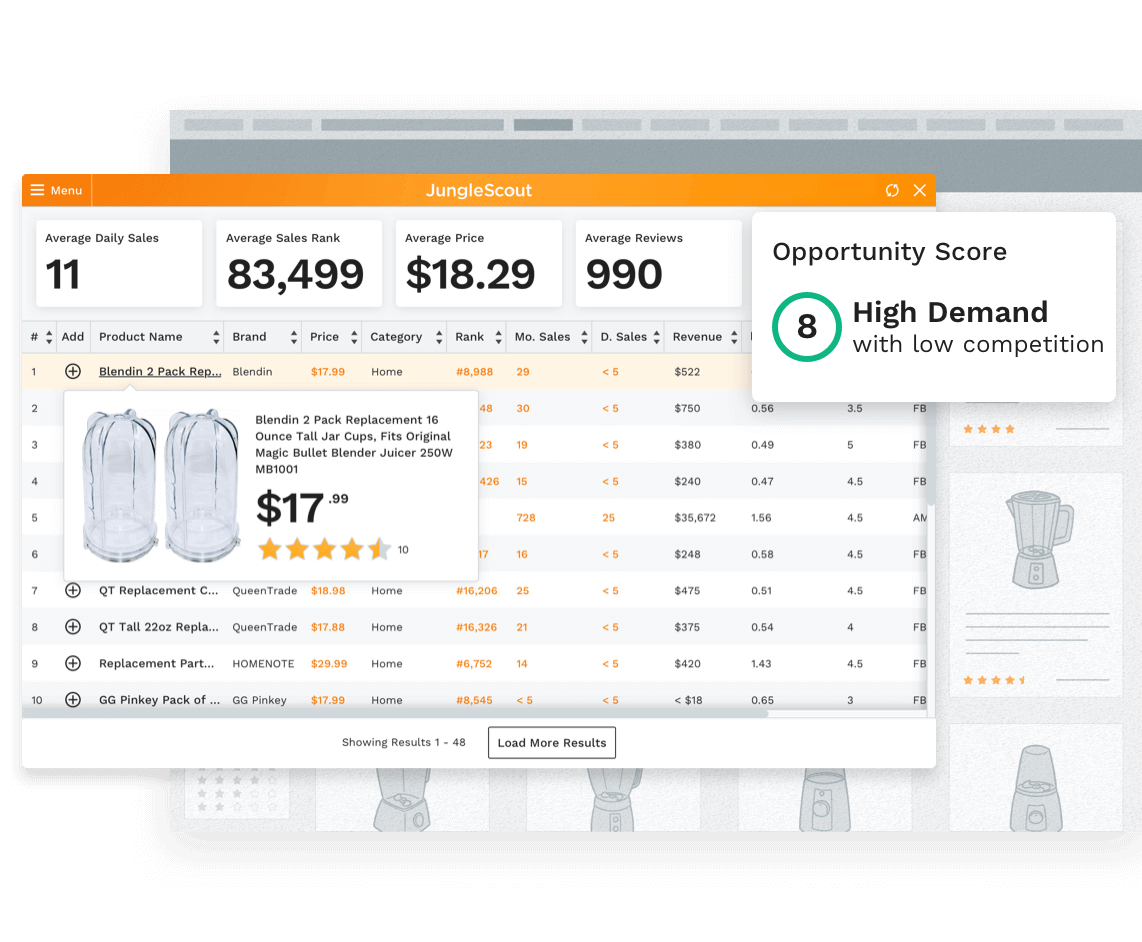
- Key metrics: monthly sales estimate, review count, Opportunity Score
- Within 3 minutes, I can tell whether a niche is worth investigating further
How Much Should You Trust the Opportunity Score?
This 1–10 rating — here’s what I’ve learned from experience:
- 8–10: Definitely worth a closer look, but don’t get ahead of yourself
- 5–7: Most real opportunities fall in this range and need further analysis
- 1–4: Either too competitive or too small a market — beginners should steer clear
One important caveat: A high score doesn’t mean you should go for it. I’ve seen products score 9 that turned out to have design patents. I’ve also seen products score 5 that I ended up doing well with because I had a supply chain advantage. The tool gives you data; the decision is still yours.
Opportunity Finder — When You Don’t Know What to Sell
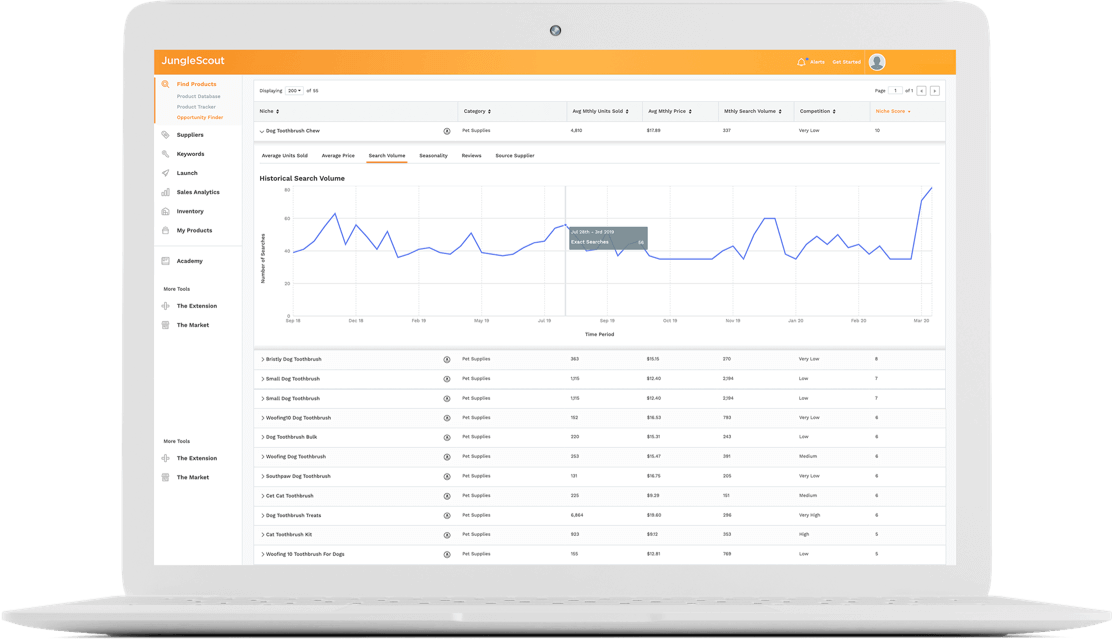
This tool is most useful when you have no direction. It surfaces opportunities by niche, and you set filter criteria to narrow results.
My filter parameters (beginner-friendly):
Niche Score: ≥ 7
Average Monthly Revenue: $5,000 - $50,000
Average Price: $15 - $45
Average Reviews: 50 - 500
Competition: Low or Medium
The logic here: Sufficient demand ($5K+ monthly revenue) without being dominated by incumbents (under 500 reviews).
The Seasonality Trap — A Lot of People Fall for This
I fell for it myself: researched Christmas decorations in December, the data looked incredible, then watched sales crater 80% in January.
My process now:
- Check the Seasonality tag first — anything marked “High” gets extra scrutiny
- Validate with Google Trends for a full-year view
- Check historical BSR curves on Keepa
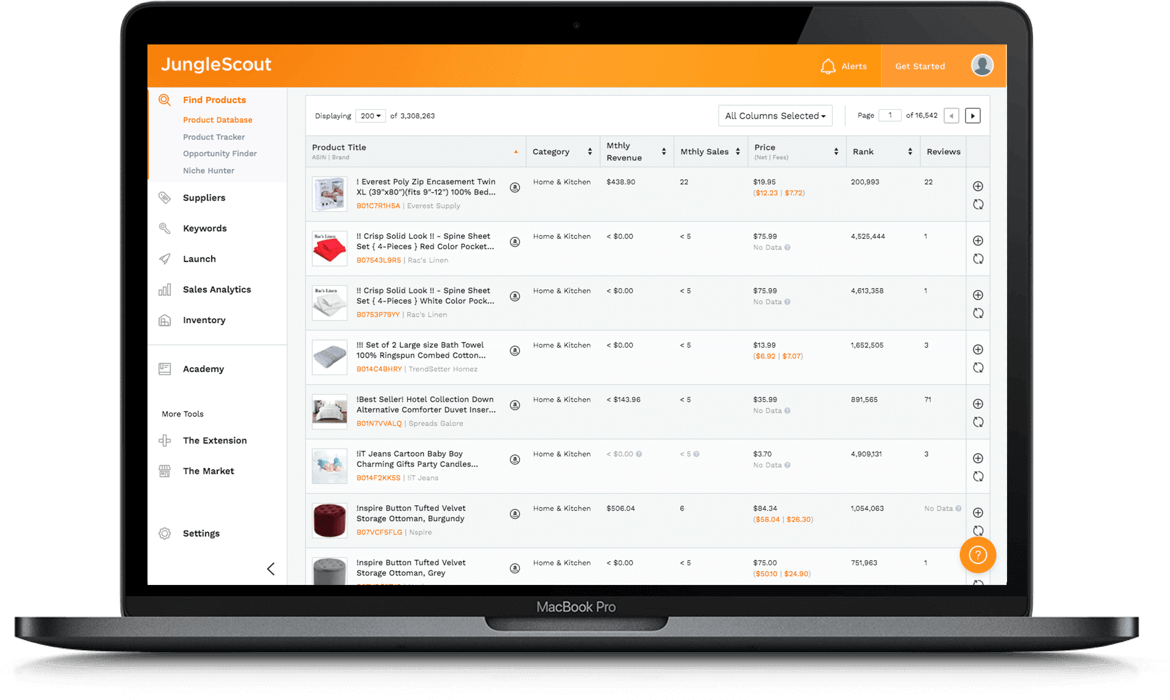
Product Database — Finding Specific Products Within a Category
How it differs from Opportunity Finder:
| Tool | Perspective | When I Use It |
|---|---|---|
| Opportunity Finder | Niche-level view | “I need to find a new category” |
| Product Database | Product-level view | “I’ve decided on kitchen products — now show me specific items” |
Practical tips:
- Check “Exclude Top Brands”: Filter out Nike, Apple, and other brands you can’t compete with
- Filter for low Listing Quality Score: Existing sellers haven’t optimized well — that’s your opportunity
- Set listing age to < 12 months: See what newcomers are selling and how they’re performing
Keyword Scout — Keyword Research
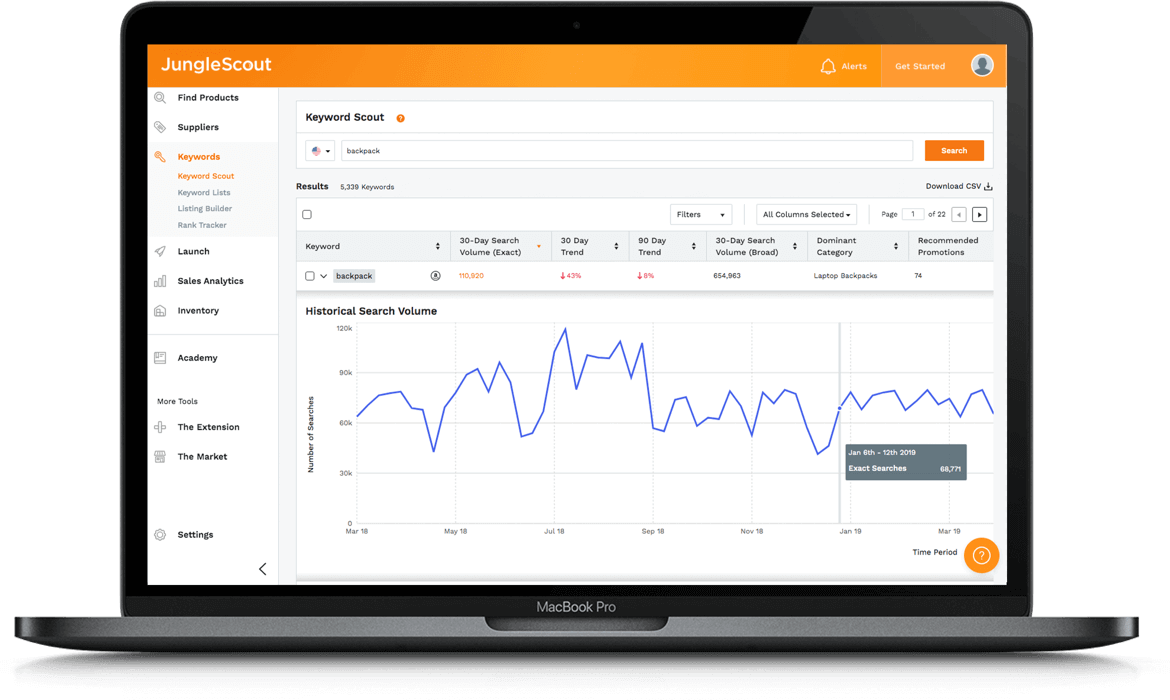
I primarily use this tool for two things:
- Checking keyword search volume: Is this keyword worth targeting?
- Reverse ASIN lookup: What keywords are my competitors ranking for?
How to read the key metrics:
| Metric | My Interpretation |
|---|---|
| Search Volume | Monthly searches — useful for sorting, don’t take the number literally |
| Trend | Directional trend matters more than the absolute number |
| Ease to Rank | “Easy” doesn’t mean it’s actually easy — just that the barrier is relatively lower |
The right way to reverse-engineer competitor keywords:
- Enter a top-performing competitor’s ASIN
- See which keywords they rank for organically
- Focus on keywords where they rank well, search volume is decent, and you’re not yet targeting them
Listing Builder — Gets the Job Done, But Nothing Special
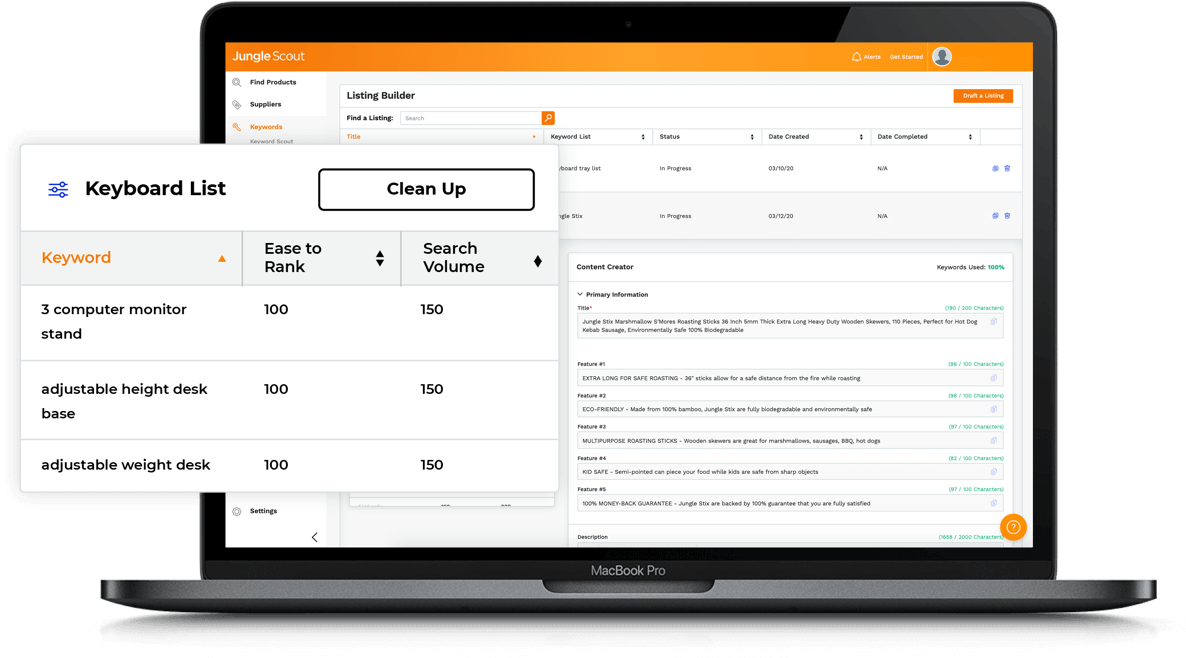
Honestly, this is one of Jungle Scout’s weaker areas. I use it for exactly two things:
- Checking whether I’ve missed any keywords
- Verifying title/bullet point character counts
If you need serious listing optimization, Helium 10’s Scribbles + Listing Builder combo is significantly better.
Product Tracker — Keeping Tabs on Competitors
![]()
I add my main competitors to the tracking list and check daily:
- Who dropped their price?
- Who’s out of stock? (That’s an opportunity)
- Whose sales just spiked? (Time to investigate what they did)
Tracking limits: 50 for Starter, 150 for Growth Accelerator. Sufficient for most sellers.
A Real Product Research Case Study
Theory only goes so far. Let me walk you through a real case to show the full product research workflow.
Background
Last year in Q2, I wanted to expand into a new category. I had 3 kitchen products at the time and wanted to add something in the home category.
Step 1: Opportunity Finder for Direction
Filter criteria:
- Category: Home & Kitchen
- Niche Score ≥ 7
- Monthly Revenue $10K–$50K
- Average Reviews < 300
The search returned about 200+ niches. I spent an afternoon narrowing them down, eliminating:
- Anything oversized or heavy (high shipping costs)
- Products with obvious patent risks
- Categories I knew nothing about
I was left with 5 viable directions. One of them: bamboo drawer organizer.
Step 2: Extension Validation of Top Products
I searched this keyword on Amazon and used the extension to scan the first two pages:
| Data Point | Observation |
|---|---|
| Top seller monthly units | 2,000–5,000 |
| Price range | $15–35 |
| Review threshold | Top products: 1,000–3,000, but products with 200–500 reviews were also selling |
| Listing quality | Inconsistent — clear room for improvement |
Initial assessment: Real demand, competition isn’t overwhelming — worth digging deeper.
Step 3: Keyword Scout Analysis
Searched “bamboo drawer organizer” and reviewed related keywords:
| Keyword | Search Volume | Ease to Rank |
|---|---|---|
| bamboo drawer organizer | 18,000 | Medium |
| drawer organizer bamboo | 8,500 | Medium |
| bamboo organizer for drawer | 3,200 | Easy |
| kitchen drawer organizer bamboo | 2,800 | Easy |
Finding: Long-tail keywords had lower competition — a viable entry point.
Step 4: Keepa Validation of Historical Data
This step is critical. I checked the BSR history of the top 5 products on Keepa:
- Sales were relatively stable with no significant seasonality
- Overall trend was slightly upward over the past year
- No unusual spikes or crashes
Step 5: Negative Review Analysis for Differentiation
I read through the 1–3 star reviews of top products. The main complaints:
- “Dimensions didn’t match the listing”
- “Bamboo had splinters”
- “Dividers aren’t adjustable”
My angle: Adjustable dividers + more precise dimension specifications + better sanding quality.
The Result
The product launched last August and is now steady at 800–1,000 units per month with approximately 28% margin. Not a home run, but a consistent earner.
Retrospective: Jungle Scout’s Role in the Process
| Stage | JS Contribution | Limitations |
|---|---|---|
| Finding direction | Opportunity Finder saved hours of manual research | Data is a starting point — judgment is still yours |
| Validating demand | Extension provided quick data snapshots | Sales figures are estimates with inherent margin of error |
| Keyword research | Keyword Scout was sufficient | Final decisions required ABA cross-validation |
| Competitor analysis | Basic functionality was adequate | Deep analysis still requires manual work |
Key lesson: The tool accelerates your process and narrows the field, but the critical calls — differentiation strategy, supply chain feasibility, profit modeling — are still on you.
Which Plan Should You Pick? My Upgrade Journey
I started on Starter, upgraded to Growth Accelerator, and have been on it for nearly two years. I tried Brand Owner for a month and cancelled. Here’s what I learned.
Plan Overview (2026 Reference Pricing)
| Plan | Monthly | Annual (per month) | Annual Total | One-Line Summary |
|---|---|---|---|---|
| Starter | $49/mo | $29/mo | $348 | Enough for product research at the exploration stage |
| Growth Accelerator | $79/mo | $49/mo | $588 | The sweet spot for most sellers |
| Brand Owner | $199/mo | $129/mo | $1,548 | Only makes sense for established brands or teams |
Note: Pricing may change. Check the official website. Black Friday typically offers additional discounts.
Why I Upgraded from Starter to Growth Accelerator
After three months on Starter, two pain points forced the upgrade:
- Tracking limit too low: 50 tracking slots — my competitors across just 3 categories added up to over 40
- Historical data too shallow: Starter only offers 1 month of history, which is nowhere near enough for trend analysis
Growth Accelerator’s 150 tracking slots and 1 year of historical data solved both issues completely. For anyone already selling, this is the best value plan.
Why I Tried Brand Owner and Cancelled
Curiosity got the better of me, so I upgraded for a month to try the competitive landscape analysis and market share insights. The features are genuinely powerful — you can see how brand share shifts across an entire niche over time.
But at $129/month for my 5-product operation, it wasn’t justifiable. These features really pay for themselves when you’re doing $500K+ annually and making brand-level strategic decisions. For managing 5 products, Growth Accelerator was more than enough.
Quick Decision Table
| Your Situation | Recommended Plan | Why |
|---|---|---|
| Haven’t started selling yet, just researching | Starter | Product research tools are sufficient; low cost to experiment |
| Selling 1–5 products | Growth Accelerator | Tracking and historical data become necessities |
| Multi-storefront / brand-building / $500K+ annual revenue | Brand Owner | Competitive intelligence justifies the cost |
| Team of 2+ people | Brand Owner | Supports 6 users |
Feature Differences Between Plans (Only Listing What Actually Differs)
All three plans include the core product research tools (Product Database, Opportunity Finder, Keyword Scout, browser extension). What actually separates them:
| Feature | Starter | Growth Accelerator | Brand Owner |
|---|---|---|---|
| Product tracking slots | 50 | 150 | 500 |
| Review Automation | No | Yes | Yes |
| Rank Tracker | Basic | Yes | Yes |
| Historical data | 1 month | 1 year | 2 years |
| Competitive landscape analysis | No | No | Yes |
| Market share insights | No | No | Yes |
| User seats | 1 | 1 | 6 |
Monthly vs. Annual Billing: Don’t Rush Into Annual
Using Growth Accelerator as an example:
- Monthly: $79 × 12 = $948/year
- Annual: $588/year
- Annual saves $360 — that’s a 38% discount
Looks like a no-brainer, but my advice: Start with monthly for 2–3 months first.
The reason is simple: annual plans don’t offer prorated refunds. A friend of mine went straight to annual on Brand Owner, realized after two months that Growth Accelerator was all he needed, and couldn’t get the difference back.
Money-Saving Tips
- Black Friday / Cyber Monday: The biggest annual discount — 30–50% off. That’s when I switched to annual billing
- Start monthly to confirm your needs: Only switch to annual once you’re committed
- 7-day refund policy: Not sure? Just try it. If it’s not for you, cancel within 7 days for a full refund — don’t hesitate
Jungle Scout vs. the Competition: My Honest Experience
Over the past three years, I’ve used every major tool on the market. I won’t tell you which one is “the best” — the best tool is the one that fits your needs.
vs. Helium 10: JS for Research, H10 for Operations
I used both tools side by side for six months each. My biggest takeaway: They’re not substitutes — they have different strengths.
| Dimension | Jungle Scout | Helium 10 |
|---|---|---|
| Learning curve | Simple — usable in 30 minutes | Steeper — takes about a week to get proficient |
| Product research | Strong, intuitive UI | Also strong, but spread across multiple tools |
| Keyword tools | Adequate | Clearly superior (Cerebro + Magnet combo) |
| Listing optimization | Basic | Comprehensive (Scribbles + Listing Builder) |
| Mainstream plan price | $49/mo | $79/mo |
| Data accuracy | AccuSales algorithm | Proprietary algorithm — roughly comparable |
My assessment:
- Product research phase: Jungle Scout wins. Opportunity Finder is more intuitive than H10’s Black Box
- Operations & optimization phase: Helium 10 wins. Reverse ASIN lookup, listing optimization — their tools go deeper
- Budget for only one? Depends on your current priority. Research-focused? Go JS. Operations-focused? Go H10
vs. SellerSprite
SellerSprite’s advantages are obvious: native Chinese interface, lower pricing, active Chinese seller community.
| Dimension | Jungle Scout | SellerSprite |
|---|---|---|
| Interface language | Primarily English | Native Chinese |
| Pricing | Higher | Noticeably cheaper |
| Localization | Average | Chinese support team, Chinese tutorials |
| Data quality | AccuSales — strong for commodity products | Also solid, with more granular data in some categories |
Straight talk: If your English isn’t strong and your budget is tight, SellerSprite is the more practical choice. Jungle Scout’s edge lies in its longer track record with its algorithm and better support for multi-marketplace international selling. If you’re running US and EU storefronts, JS offers a more unified experience.
vs. Free Alternatives (Keepa + Manual Research)
New sellers constantly ask me: Do I really need to pay for a tool?
The answer: Not necessarily. It depends on where you are.
| Capability | Keepa ($19/mo) | Jungle Scout |
|---|---|---|
| Historical price / BSR tracking | Excellent — extremely detailed | Yes |
| Sales estimates | No — you have to calculate yourself | Yes — provided directly |
| Keyword research | No | Yes |
| Bulk product screening | No | Yes |
What I actually do: Use Jungle Scout + Keepa together. JS handles opportunity discovery and initial screening; Keepa handles historical trend validation. Cross-referencing data from both tools is more reliable than using either alone.
If you’re truly budget-constrained, Keepa + manually browsing Amazon pages can cover basic product research — it’s just far less efficient. Wait until your first product generates revenue, then invest in JS.
My Tool Spending at Each Stage
| Stage | Tool Stack | Monthly Cost | Worth It in Retrospect? |
|---|---|---|---|
| Research phase | JS Starter + Keepa | ~$50 | Yes — saved enormous time |
| Launch phase | JS Growth Accelerator | ~$50 | Yes — tracking became essential |
| Growth phase | JS Growth + Keepa | ~$70 | Best value stage |
| Current | JS Growth + Keepa + ABA | ~$70 | ABA is free but requires Brand Registry |
Mistakes I’ve Made: Common Pitfalls
These are real mistakes — mine or from seller friends — that I hope you can avoid.
Pitfall 1: Treating Estimated Sales as Actual Sales for Inventory Orders
My first product sourcing decision: JS showed an estimated 3,000 monthly sales, so I excitedly ordered 800 units. Actual monthly sales after launch? Just over 400. I spent the better part of a year burning through storage fees to clear that inventory.
What I learned:
- Discount sales estimates by at least 30% — for commodity products you can be slightly more optimistic; for non-commodity products, cut the estimate in half
- Always cross-verify with Keepa’s historical BSR to confirm sales stability
- First order should only cover 1–2 months of inventory — let real data guide replenishment
Pitfall 2: Chasing High Niche Scores Blindly
For a while, I only pursued categories with Niche Score 8+. That led me straight into two disasters: one product had a design patent issue, another required FDA certification. The scoring algorithm doesn’t account for compliance or IP risks.
My process now: Niche Score is just the first-pass filter. Any category scoring 7+ still has to clear four additional gates:
- US trademark/patent search (USPTO is free)
- Regulatory compliance check (FDA, FCC, CPC, etc.)
- Supplier outreach to confirm feasibility and cost
- Detailed profit calculation (including freight, FBA fees, return rate)
Pitfall 3: Equating High Search Volume with Advertising Opportunity
JS showed “bamboo cutting board” at 80,000 monthly searches. I assumed high traffic = high opportunity and went aggressive with ad spend on that keyword. CPC was $3+, ACoS shot to 80%.
Search volume and ad ROI are two completely different things. High search volume often means more sellers competing for that keyword, which drives CPC up.
My ad strategy now:
- Bid based on margin and target ACoS — I don’t reference third-party search volume data for ad decisions
- Run auto campaigns for two weeks first to collect real search term and conversion data
- Then build manual exact-match campaigns from actual performance data
Pitfall 4: Letting the Tool Do the Thinking
The biggest and most insidious trap. For a stretch, I relied entirely on data for product decisions. The products I picked all had great numbers — but they didn’t sell well because I had never actually ordered competing products or understood what customers truly cared about.
What tools can’t tell you: How the product feels in your hands, a customer’s first reaction when unboxing it, the real pain points buried in negative reviews.
Since then, I’ve added a non-negotiable step: Once I’ve narrowed my product direction, I spend $100–200 ordering 3–5 competing products to use myself. That investment is worth more than any software subscription.
When You Shouldn’t Use Jungle Scout
I’ve seen sellers pay for the tool and get no value from it. Most of the time, it’s because they used it in the wrong context.
Your Category’s Data Is Inherently Unreliable
This is the most overlooked issue. JS’s algorithm has significantly higher error margins in certain categories:
- Apparel & footwear: Too many variations, high return rates — I’ve seen deviations of 40–60%
- High-ticket, low-frequency items: Furniture, large appliances — too few data points for stable modeling
- Emerging / niche categories: Insufficient data accumulation, models haven’t been calibrated
These categories rely more on your industry expertise and supply chain judgment. Tool data is supplementary at best.
Your Budget Is Genuinely Tight
$49/month isn’t trivial if you haven’t made your first sale yet. If that amount makes you wince, your priorities likely belong elsewhere right now.
Use free alternatives instead: Keepa ($19/month) + manually browsing Amazon + JS’s free browser extension can handle basic research. Upgrade once your first product starts generating revenue.
You Already Have a Tool Stack
If you’re already on Helium 10’s full suite or a SellerSprite + Keepa combo, there’s no need to add JS. Too much overlap — more spending doesn’t equal more earnings.
Your Bottleneck Isn’t Product Research
This is the point I think is most worth making. Some sellers cycle endlessly through product research without ever launching a single product. Their problem isn’t “not knowing what to sell” — it’s that they can’t secure suppliers, don’t have enough capital, can’t write a listing, or are afraid to run ads.
A product research tool can’t solve execution problems. If that’s where you are, get your first product out the door — even if the selection isn’t perfect. You’ll learn more from real-world experience than any tool can teach you.
Advanced Tactics: Getting More Out of the Tool
These are workflows I developed after a year or two of use. Once you’re comfortable with the basics, give these a try.
JS + ABA Cross-Validation: Doubling Your Data Confidence
![]()
If you have Brand Registry, this combination is my top recommendation. Amazon Brand Analytics (ABA) is official data, and pairing it with JS fills in each tool’s blind spots:
| What I’m Looking At | Using JS | Using ABA | Why Combine Them |
|---|---|---|---|
| Keyword search volume | Provides absolute numbers | Provides relative ranking | JS numbers aren’t precise enough; ABA rankings lack specific volumes — cross-reference both |
| Competitive landscape | Shows sales distribution | Shows click/conversion share | ABA reveals who’s capturing the traffic |
| Trend analysis | Has trend charts | Has periodic ranking changes | When both agree a trend is up, you can trust it |
My workflow:
- Find target keywords in JS, note the search volume
- Look up the same keyword in ABA for search frequency rank and Top 3 clicked ASINs
- If the Top 3 ASINs capture 50%+ of clicks — head concentration is too high, and a new product will struggle to gain traction
- Target keywords with decent volume but low head concentration — that’s where the real opportunity is
Turning Product Tracker Into a Competitive Intelligence System
![]()
The first thing I do every morning is check Product Tracker for changes. This habit has helped me capitalize on several opportunities:
- Competitor out of stock: One time, a top competitor went out of stock for two weeks. I immediately increased ad spend, jumped 20 positions in organic rank during that window, and held the improved ranking even after they restocked
- Competitor price drop: Signals potential inventory liquidation or a price war — I need to decide whether to match
- New product gaining traction fast: Study their listing, pricing, and launch strategy — there’s always something to learn
My tracking setup:
- Direct competitors: 5–8 products (check daily)
- Category leaders: Top 5 (understand the ceiling)
- New entrants: 5–10 products (learn emerging playbooks)
Seasonal Product Research: Timing Matters More Than Product Selection
After getting burned on seasonality, I put together this timeline:
| Peak Season | Category Examples | When I Start Research | Latest Launch Date |
|---|---|---|---|
| Q4 (Black Friday, Christmas) | Gifts, decorations | June | Early September |
| Summer | Outdoor, swimming | January | End of March |
| Back to school | Stationery, backpacks | April | End of June |
Core principle: Start research 4–6 months ahead, launch 2–3 months ahead. New products need time to accumulate reviews and build rank. If you launch when the peak season hits, you’re already too late.
Finding Blue Oceans Across Marketplaces
Comparing the same product across different marketplaces in JS often turns up surprises. I have a product doing 800 units/month on the US marketplace with fierce competition. When I checked the Germany marketplace through JS — only about a dozen sellers for the same type of product, review threshold under 100, and solid monthly demand. That product now has a profit margin 10 percentage points higher in Germany than in the US.
Marketplaces worth exploring: Germany, UK (moderate competition), Japan (strong demand, few sellers).
FAQ: Questions You’ll Actually Ask
This section covers the questions I get asked most frequently and the areas where newcomers are most confused.
About the Data
Q: How far off are Jungle Scout’s sales estimates? Can I use them for inventory decisions?
A: Based on my test of 30 of my own products, commodity product estimates deviate by about 20%, while non-commodity products (apparel, etc.) can be off by 40% or more. I don’t recommend using estimated numbers directly for inventory decisions. The right approach: discount estimates by 30%, cross-validate with Keepa’s historical data, and keep your first order conservative.
Q: How much do JS search volumes differ from Amazon Brand Analytics (ABA)? Which one should I trust?
A: Directional trends are generally consistent, but absolute values can diverge significantly. A keyword JS shows at 50,000 might correspond to 30,000 or 80,000 in ABA’s actual rankings. JS is fine for trend assessment; rely on ABA for precise figures. If you have Brand Registry, use both together.
Q: Some categories clearly have inaccurate data. How do I judge which categories I can trust?
A: The pattern is: commodity > non-commodity, high-frequency > low-frequency, established categories > emerging categories. Kitchen supplies and home organization tend to be reliable; apparel and jewelry with many variations and high return rates have bigger error margins. High-ticket, low-frequency items (like furniture) have too few data points for stable estimates.
About Pricing
Q: Growth Accelerator costs only $20/month more than Starter. Is the upgrade worth it?
A: Depends on whether you’re actively selling. Still in research mode? Starter is sufficient. Already selling? Growth Accelerator’s tracking capacity (150 vs. 50) and historical data (1 year vs. 1 month) are genuine necessities. The biggest difference I noticed after upgrading was finally being able to track all my competitors.
Q: I already have Helium 10. Do I need Jungle Scout too?
A: Probably not. The two tools have high feature overlap, and running both mainly means spending more. Unless you specifically need JS’s Opportunity Finder for product research (which genuinely is more intuitive than H10’s Black Box), pick one and master it.
Q: Annual billing saves money, but what if I change my mind?
A: Annual plans don’t offer prorated refunds. My advice: Start with monthly for 2–3 months, confirm you need it long-term, then switch to annual during Black Friday. I’ve personally seen multiple sellers regret locking into annual too early.
About Usage
Q: What’s the difference between Opportunity Score and Niche Score? How do they work together?
A: Opportunity Score appears in the browser extension and evaluates individual product opportunity. Niche Score appears in Opportunity Finder and evaluates an entire market segment. Use Niche Score to filter market directions first, then use Opportunity Score to evaluate specific products. When both are high, it’s worth investigating further.
Q: Product Database or Opportunity Finder — which one should I use?
A: It depends on whether you have a direction. No direction? Use Opportunity Finder — it surfaces opportunities by niche to spark ideas. Have a direction? Use Product Database — e.g., you’ve already decided on kitchen products, and you need to find specific items. They work sequentially, not as substitutes.
Q: How often does data update? Why do my numbers look different from someone else’s screenshots?
A: Core data (sales, pricing, rankings) updates daily. Keyword search volume updates roughly weekly. Differences from others typically come from data refresh timing, different plan refresh frequencies, or browser caching. Try refreshing the page.
Q: Can I use it without strong English skills?
A: It’s manageable. There’s partial Chinese language support, but the core interface and help documentation are in English. If language is a significant barrier, consider SellerSprite — its native Chinese experience is substantially better.
My Final Verdict
After three years with Jungle Scout, if I had to sum up its value in one sentence: It transforms product research from guesswork into data-informed decision-making.
Let’s Do the Math
In the bamboo organizer case study I described, that product now sells 800–1,000 units per month at 28% margin with a $25 average selling price. That’s roughly $5,600–7,000 in monthly net profit.
Jungle Scout Growth Accelerator costs $588 per year. A single successful product pays for the entire year’s subscription in one month.
Of course, that’s a success story. I’ve also had product research failures. The tool helped me avoid some pitfalls, but not all of them. The tool’s value isn’t in guaranteeing success — it’s in improving your odds and reducing the cost of mistakes.
Who Should Use This
It comes down to one profile: Sellers who are serious about Amazon, need to find or expand their product line, and are willing to make data-driven decisions. Whether you’re a beginner or a veteran, as long as you’re still doing product research, JS can make you more efficient.
Who Should Save Their Money
- Still undecided about whether to sell on Amazon — figure that out first
- Extremely tight budget where $30/month is painful — get your first product off the ground first
- Already have a full Helium 10 or SellerSprite setup — no need for duplicate subscriptions
- Only doing wholesale/arbitrage — product research tools aren’t relevant
If You Decide to Give It a Try
Here’s the path I recommend — and the same one I followed:
Step 1: Install the free browser extension. Browse Amazon casually and see what data the extension provides. If you find it useful, that’s a sign you need this tool.
Step 2: Start with one month of Starter at $49. It’s a reasonable investment for a full product research experience. Focus on Opportunity Finder and Product Database.
Step 3: Run a complete product research cycle. Not a casual browse — walk through the entire workflow: find a direction → screen products → research keywords → validate data. You can only judge the tool’s value after you’ve genuinely used it.
Step 4: Decide based on your experience. If it’s worthwhile, keep going. If not, request a refund within 7 days — no money lost. If you’re staying long-term, switch to annual billing on Black Friday for the best deal.
Last updated: January 2026
Disclaimer: This article is based on personal experience and publicly available information. Data and results cited reflect individual experience and may not be representative of all sellers’ outcomes. Pricing and features are subject to change — please refer to the official Jungle Scout website for current information. Other tools mentioned (Helium 10, SellerSprite, Keepa, etc.) are products of their respective companies.